Carson River Basin
#Recordset1.GageName#
Gaging Station #Recordset1.GageNumber#
Streamflow Data from NWISweb:
Real Time || Daily Streamflow Statistics || Peak Streamflow
Flood Data:
| Flood Event | Discharge Date | Peak (cfs) |
Stage (feet) |
|---|---|---|---|
#Recordset3.Name# |
#LSDateFormat(Recordset3.DateDischarge,'M/DD/YYYY')# |
#LSNumberFormat(Recordset3.PeakDischarge,',99999999999999')# |
#Recordset3.Stage# |
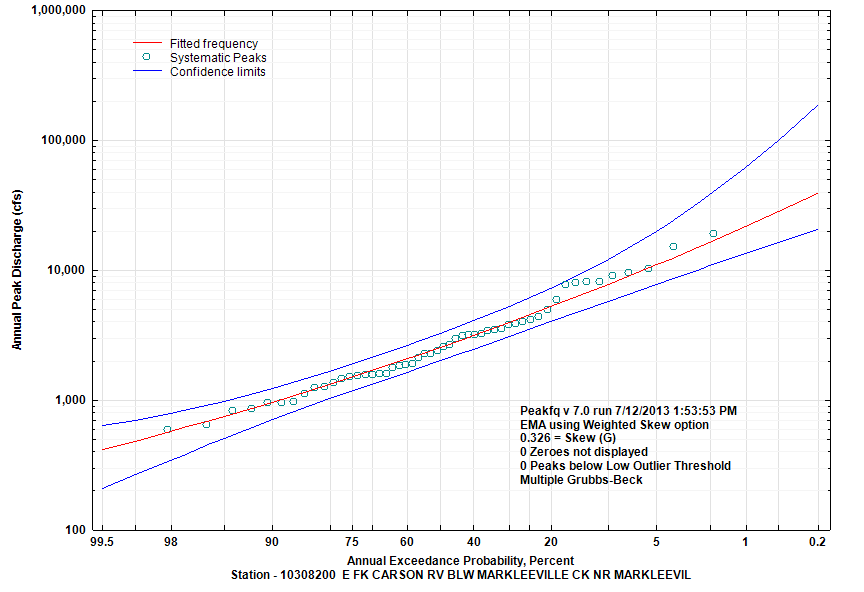
Annual Peak Flows:
Flood Frequency:
Additional flood-frequency descriptions will be added as available.
| Annual Exceedance Probablity (percent) | Annual Exceedance Flow (cfs) |
95% Confidence Interval (cfs) | |
|---|---|---|---|
| Lower |
Upper |
||
| 99.5 | 5.8 | 0.1 | 17.1 |
| 99 | 7.5 | 0.3 | 19.1 |
| 95 | 15.5 | 1.6 | 29.5 |
| 90 | 23.3 | 3.3 | 41 |
| 80 | 39 | 7 | 67.9 |
| 66.67 | 64.4 | 23.6 | 120.2 |
| 50 | 111.2 | 56.3 | 228.6 |
| 42.92 | 140.2 | 73.8 | 301.2 |
| 20 | 343.2 | 174.9 | 970.1 |
| 10 | 639.4 | 301.2 | 2568 |
| 4 | 1274 | 532.1 | 9034 |
| 2 | 2016 | 760.8 | 22970 |
| 1 | 3076 | 1039 | 58030 |
| 0.5 | 4565 | 1370 | 146400 |
| 0.2 | 7441 | 1893 | 463100 |
