Carson River Basin
#Recordset1.GageName#
Gaging Station #Recordset1.GageNumber#
Streamflow Data from NWISweb:
Real Time || Daily Streamflow Statistics || Peak Streamflow
Flood Data:
| Flood Event | Discharge Date | Peak (cfs) |
Stage (feet) |
|---|---|---|---|
#Recordset3.Name# |
#LSDateFormat(Recordset3.DateDischarge,'M/DD/YYYY')# |
#LSNumberFormat(Recordset3.PeakDischarge,',99999999999999')# |
#Recordset3.Stage# |
Annual Peak Flows:
Flood Frequency:
Additional flood-frequency descriptions will be added as available.
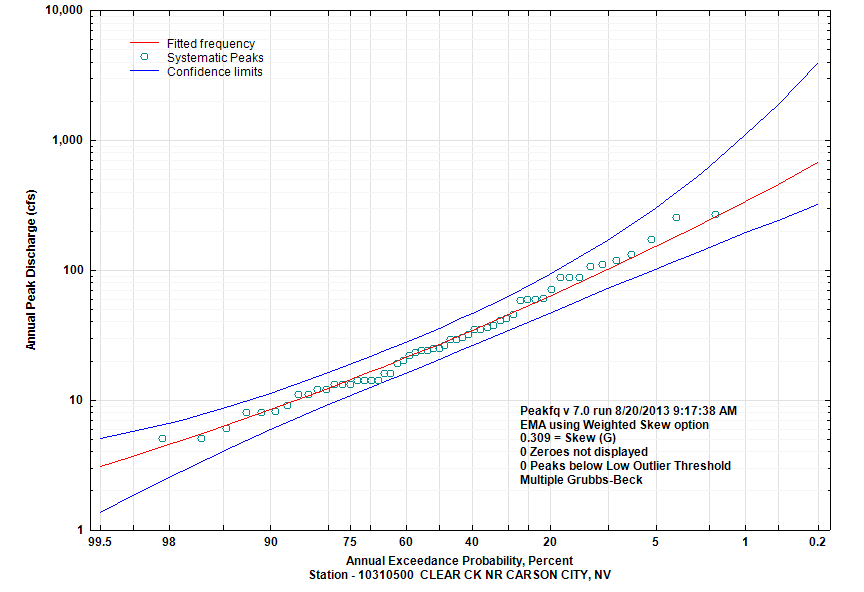
| Annual Exceedance Probablity (percent) | Annual Exceedance Flow (cfs) |
95% Confidence Interval (cfs) | |
|---|---|---|---|
| Lower |
Upper |
||
| 99.5 | 3.1 | 1.4 | 5 |
| 99 | 3.7 | 1.8 | 5.6 |
| 95 | 6.2 | 4 | 8.5 |
| 90 | 8.4 | 5.9 | 11.2 |
| 80 | 12.3 | 9.2 | 16.1 |
| 66.67 | 17.8 | 13.6 | 23.4 |
| 50 | 26.8 | 20.4 | 35.6 |
| 42.92 | 31.9 | 24.2 | 42.8 |
| 20 | 62.7 | 46.3 | 91.4 |
| 10 | 100.6 | 71.3 | 166.8 |
| 4 | 170.5 | 112 | 357.3 |
| 2 | 242.6 | 149.2 | 627.8 |
| 1 | 336 | 192.2 | 1093 |
| 0.5 | 455.9 | 241.6 | 1887 |
| 0.2 | 666 | 317.3 | 3842 |
