Carson River Basin
#Recordset1.GageName#
Gaging Station #Recordset1.GageNumber#
Streamflow Data from NWISweb:
Real Time || Daily Streamflow Statistics || Peak Streamflow
Flood Data:
| Flood Event | Discharge Date | Peak (cfs) |
Stage (feet) |
|---|---|---|---|
#Recordset3.Name# |
#LSDateFormat(Recordset3.DateDischarge,'M/DD/YYYY')# |
#LSNumberFormat(Recordset3.PeakDischarge,',99999999999999')# |
#Recordset3.Stage# |
Annual Peak Flows:
Flood Frequency:
Additional flood-frequency descriptions will be added as available.
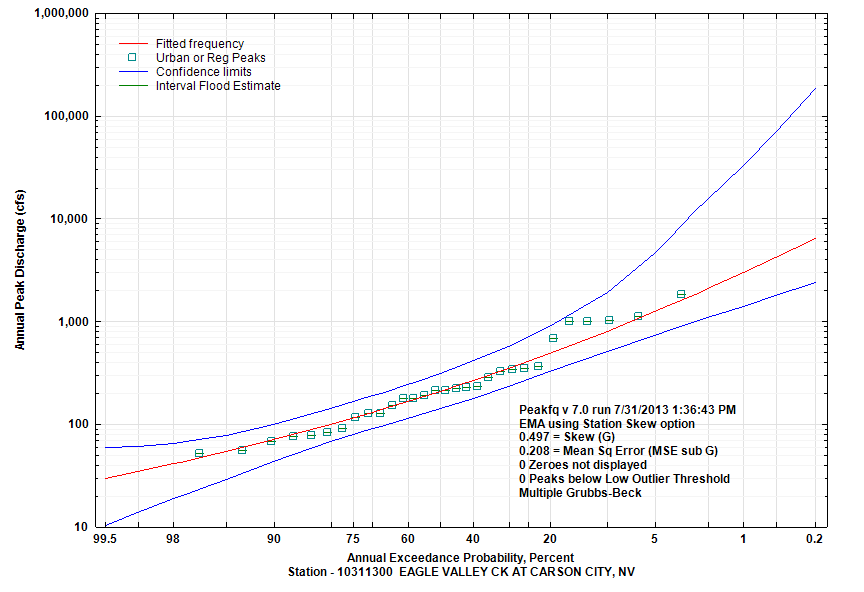
| Annual Exceedance Probablity (percent) | Annual Exceedance Flow (cfs) |
95% Confidence Interval (cfs) | |
|---|---|---|---|
| Lower |
Upper |
||
| 99.5 | 29.6 | 10.3 | 58.3 |
| 99 | 34.3 | 13.8 | 60.7 |
| 95 | 53.7 | 28.6 | 77.3 |
| 90 | 69.9 | 42.6 | 98.8 |
| 80 | 98.8 | 67.9 | 142.6 |
| 66.67 | 140.1 | 97.5 | 203.6 |
| 50 | 207.9 | 140.4 | 310.1 |
| 42.92 | 246.8 | 165.3 | 376 |
| 20 | 489.3 | 321 | 884.2 |
| 10 | 801.9 | 502.9 | 1907 |
| 4 | 1409 | 802.2 | 6193 |
| 2 | 2069 | 1079 | 15260 |
| 1 | 2964 | 1403 | 32490 |
| 0.5 | 4167 | 1782 | 68690 |
| 0.2 | 6392 | 2373 | 184400 |
