Carson River Basin
#Recordset1.GageName#
Gaging Station #Recordset1.GageNumber#
Streamflow Data from NWISweb:
Real Time || Daily Streamflow Statistics || Peak Streamflow
Flood Data:
| Flood Event | Discharge Date | Peak (cfs) |
Stage (feet) |
|---|---|---|---|
#Recordset3.Name# |
#LSDateFormat(Recordset3.DateDischarge,'M/DD/YYYY')# |
#LSNumberFormat(Recordset3.PeakDischarge,',99999999999999')# |
#Recordset3.Stage# |
Annual Peak Flows:
Flood Frequency:
Additional flood-frequency descriptions will be added as available.
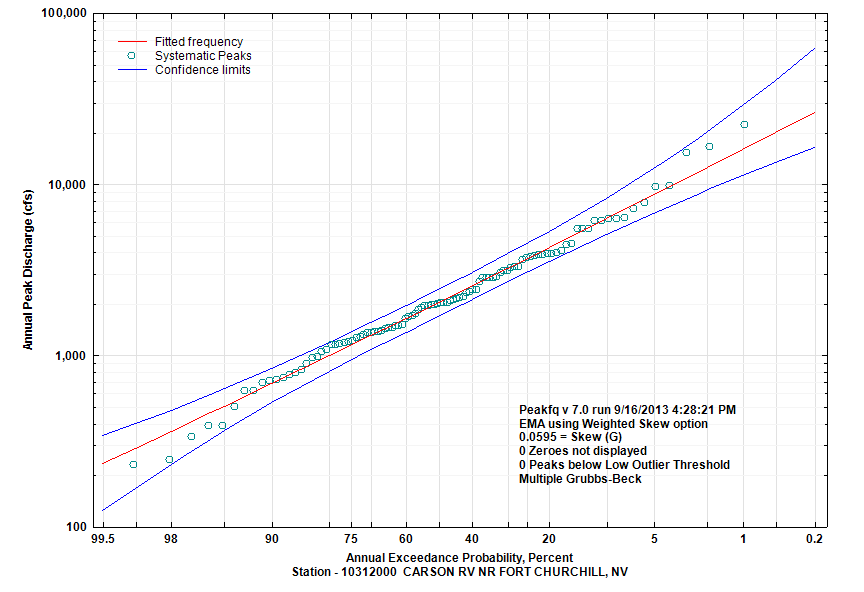
| Annual Exceedance Probablity (percent) | Annual Exceedence Flow (cfs) |
95% Confidence Interval (cfs) | |
|---|---|---|---|
| Lower |
Upper |
||
| 99.5 | 233.7 | 124.6 | 340.7 |
| 99 | 286.9 | 168 | 398.1 |
| 95 | 505.1 | 362.6 | 637.1 |
| 90 | 685 | 529 | 840.1 |
| 80 | 993.7 | 807.9 | 1197 |
| 66.67 | 1411 | 1170 | 1688 |
| 50 | 2043 | 1706 | 2448 |
| 42.92 | 2384 | 1992 | 2865 |
| 20 | 4253 | 3517 | 5279 |
| 10 | 6269 | 5067 | 8257 |
| 4 | 9516 | 7358 | 14030 |
| 2 | 12490 | 9257 | 20330 |
| 1 | 15970 | 11290 | 28880 |
| 0.5 | 20020 | 13450 | 40400 |
| 0.2 | 26360 | 16490 | 61760 |
