Walker River Basin
#Recordset1.GageName#
Gaging Station #Recordset1.GageNumber#
Streamflow Data from NWISweb:
Real Time || Daily Streamflow Statistics || Peak Streamflow
Peak Flow Data:
| Flood Event | Discharge Date | Peak (cfs) |
Stage (feet) |
|---|---|---|---|
#Recordset3.Name# |
#LSDateFormat(Recordset3.DateDischarge,'M/DD/YYYY')# |
#LSNumberFormat(Recordset3.PeakDischarge,',99999999999999')##Recordset3.peak_CD# |
#Recordset3.Stage# |
- 6Discharge affected by Regulation or Diversion
Annual Peak Flows:
Flood Frequency:
Additional flood-frequency descriptions will be added as available.
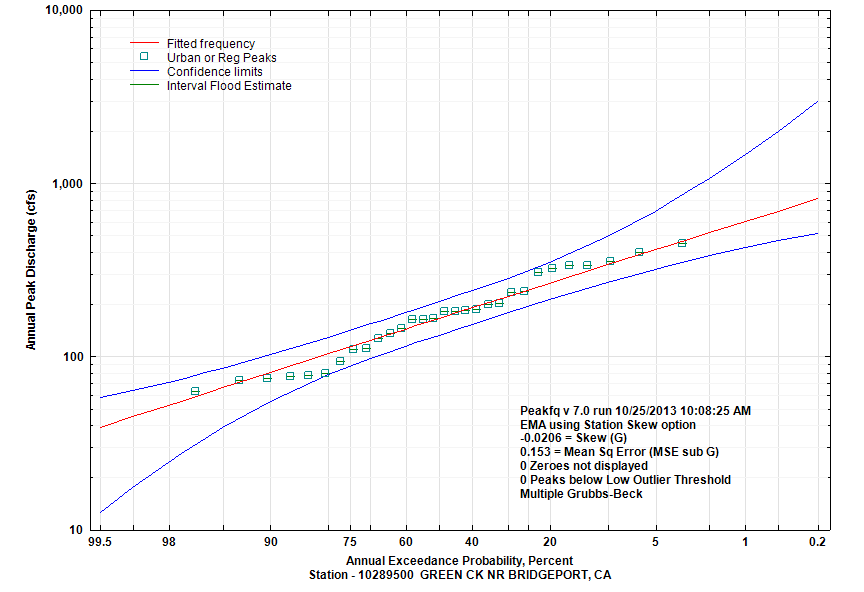
| Annual Exceedance Probablity (percent) | Annual Exceedance Flow (cfs) |
95% Confidence Interval (cfs) | |
|---|---|---|---|
| Lower |
Upper |
||
| 99.5 | 38.8 | 12.6 | 57.8 |
| 99 | 44.7 | 17.5 | 63.5 |
| 95 | 65.8 | 38.8 | 85.5 |
| 90 | 80.7 | 55.1 | 102.5 |
| 80 | 103.4 | 78.2 | 129.4 |
| 66.67 | 130.2 | 102.6 | 162.1 |
| 50 | 165.8 | 132.7 | 206.9 |
| 42.92 | 183.1 | 147 | 229.5 |
| 20 | 264.9 | 212.1 | 348.7 |
| 10 | 338.2 | 267.1 | 490.9 |
| 4 | 438.4 | 335.4 | 769.2 |
| 2 | 518.1 | 382.6 | 1069 |
| 1 | 602 | 426 | 1468 |
| 0.5 | 690.5 | 465.9 | 2000 |
| 0.2 | 815 | 514.1 | 2944 |
