Walker River Basin
#Recordset1.GageName#
Gaging Station #Recordset1.GageNumber#
Streamflow Data from NWISweb:
Real Time || Daily Streamflow Statistics || Peak Streamflow
Peak Flow Data:
| Flood Event | Discharge Date | Peak (cfs) |
Stage (feet) |
|---|---|---|---|
#Recordset3.Name# |
#LSDateFormat(Recordset3.DateDischarge,'M/DD/YYYY')# |
#LSNumberFormat(Recordset3.PeakDischarge,',99999999999999')##Recordset3.peak_CD# |
#Recordset3.Stage# |
- 6Discharge affected by Regulation or Diversion
Annual Peak Flows:
Flood Frequency:
Additional flood-frequency descriptions will be added as available.
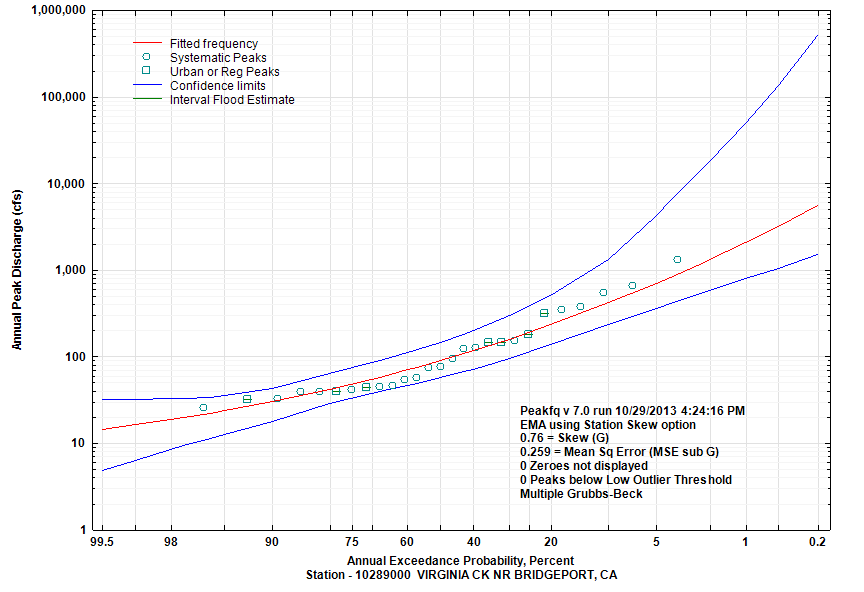
| Annual Exceedance Probablity (percent) | Annual Exceedance Flow (cfs) |
95% Confidence Interval (cfs) | |
|---|---|---|---|
| Lower |
Upper |
||
| 99.5 | 82.1 | 46.7 | 112.4 |
| 99 | 90.8 | 55.9 | 118.9 |
| 95 | 121.5 | 88.9 | 146.8 |
| 90 | 143.1 | 112.8 | 170.3 |
| 80 | 175.7 | 146 | 208.1 |
| 66.67 | 214.6 | 180.6 | 253.9 |
| 50 | 266.8 | 224.4 | 317.8 |
| 42.92 | 292.8 | 246 | 350.8 |
| 20 | 418.7 | 348.5 | 529 |
| 10 | 537 | 437.6 | 744.5 |
| 4 | 707.4 | 553.6 | 1190 |
| 2 | 850.1 | 640.9 | 1723 |
| 1 | 1007 | 728.1 | 2516 |
| 0.5 | 1179 | 815.7 | 3595 |
| 0.2 | 1434 | 932.3 | 5425 |
