Walker River Basin
#Recordset1.GageName#
Gaging Station #Recordset1.GageNumber#
Streamflow Data from NWISweb:
Real Time || Daily Streamflow Statistics || Peak Streamflow
Peak Flow Data:
| Flood Event | Discharge Date | Peak (cfs) |
Stage (feet) |
|---|---|---|---|
#Recordset3.Name# |
#LSDateFormat(Recordset3.DateDischarge,'M/DD/YYYY')# |
#LSNumberFormat(Recordset3.PeakDischarge,',99999999999999')##Recordset3.peak_CD# |
#Recordset3.Stage# |
- 1Discharge is a Maximum Daily Average
- 2Discharge is an Estimate
- 5Discharge affected to unknown degree by Regulation or Diversion
Annual Peak Flows:
Flood Frequency:
Additional flood-frequency descriptions will be added as available.
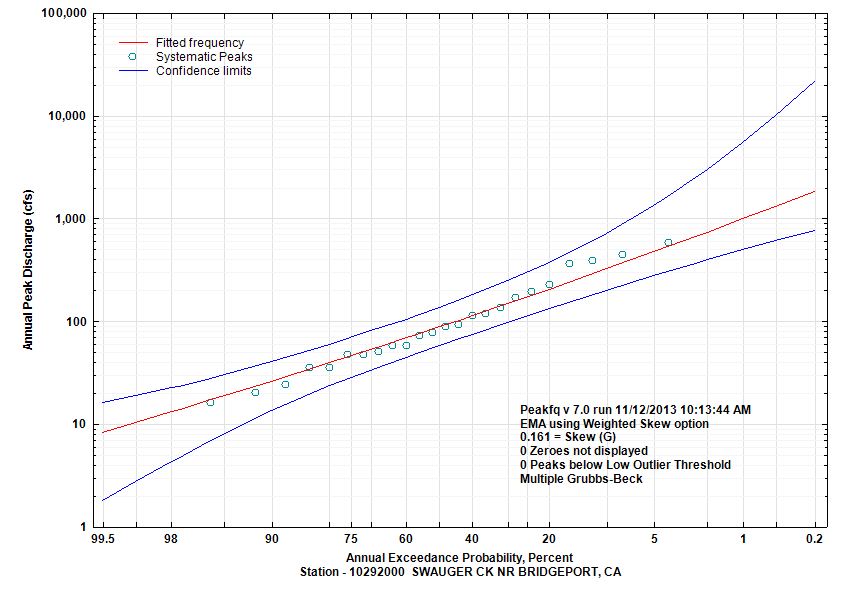
| Annual Exceedance Probablity (percent) | Annual Exceedance Flow (cfs) |
95% Confidence Interval (cfs) | |
|---|---|---|---|
| Lower |
Upper |
||
| 99.5 | 8.3 | 1.8 | 16.3 |
| 99 | 10.3 | 2.8 | 18.8 |
| 95 | 18.8 | 8 | 30.1 |
| 90 | 26.1 | 13.4 | 40.4 |
| 80 | 39.2 | 23.4 | 59.6 |
| 66.67 | 57.9 | 37 | 88 |
| 50 | 87.9 | 57.7 | 136.3 |
| 42.92 | 104.8 | 68.9 | 165.4 |
| 20 | 204.5 | 131.8 | 371.7 |
| 10 | 322.7 | 199.9 | 712.6 |
| 4 | 531.2 | 305.6 | 1638 |
| 2 | 737.5 | 396.9 | 3021 |
| 1 | 995.1 | 497.1 | 5509 |
| 0.5 | 1314 | 605.9 | 9954 |
| 0.2 | 1848 | 762 | 21520 |
