Walker River Basin
#Recordset1.GageName#
Gaging Station #Recordset1.GageNumber#
Streamflow Data from NWISweb:
Real Time || Daily Streamflow Statistics || Peak Streamflow
Peak Flow Data:
| Flood Event | Discharge Date | Peak (cfs) |
Stage (feet) |
|---|---|---|---|
#Recordset3.Name# |
#LSDateFormat(Recordset3.DateDischarge,'M/DD/YYYY')# |
#LSNumberFormat(Recordset3.PeakDischarge,',99999999999999')##Recordset3.peak_CD# |
#Recordset3.Stage# |
- 2Discharge is an Estimate
Annual Peak Flows:
Flood Frequency:
Additional flood-frequency descriptions will be added as available.
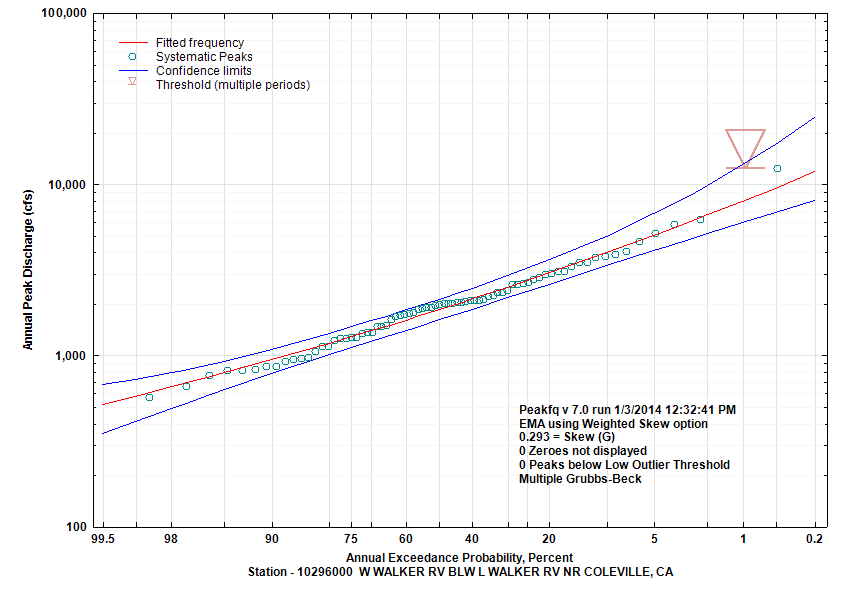
| Annual Exceedance Probablity (percent) | Annual Exceedance Flow (cfs) |
95% Confidence Interval (cfs) | |
|---|---|---|---|
| Lower |
Upper |
||
| 99.5 | 519.6 | 350.4 | 673.6 |
| 99 | 579 | 411.8 | 723.5 |
| 95 | 790.4 | 631.9 | 923.2 |
| 90 | 942.2 | 787.9 | 1084 |
| 80 | 1176 | 1016 | 1345 |
| 66.67 | 1461 | 1274 | 1671 |
| 50 | 1851 | 1615 | 2129 |
| 42.92 | 2048 | 1785 | 2365 |
| 20 | 3030 | 2607 | 3612 |
| 10 | 3982 | 3349 | 4982 |
| 4 | 5396 | 4354 | 7389 |
| 2 | 6611 | 5142 | 9840 |
| 1 | 7972 | 5960 | 13010 |
| 0.5 | 9499 | 6812 | 17110 |
| 0.2 | 11810 | 7992 | 24400 |
