Walker River Basin
#Recordset1.GageName#
Gaging Station #Recordset1.GageNumber#
Streamflow Data from NWISweb:
Real Time || Daily Streamflow Statistics || Peak Streamflow
Peak Flow Data:
| Flood Event | Discharge Date | Peak (cfs) |
Stage (feet) |
|---|---|---|---|
#Recordset3.Name# |
#LSDateFormat(Recordset3.DateDischarge,'M/DD/YYYY')# |
#LSNumberFormat(Recordset3.PeakDischarge,',99999999999999')##Recordset3.peak_CD# |
#Recordset3.Stage# |
- 1Discharge is a Maximum Daily Average
- 2Discharge is an Estimate
Annual Peak Flows:
Flood Frequency:
Additional flood-frequency descriptions will be added as available.
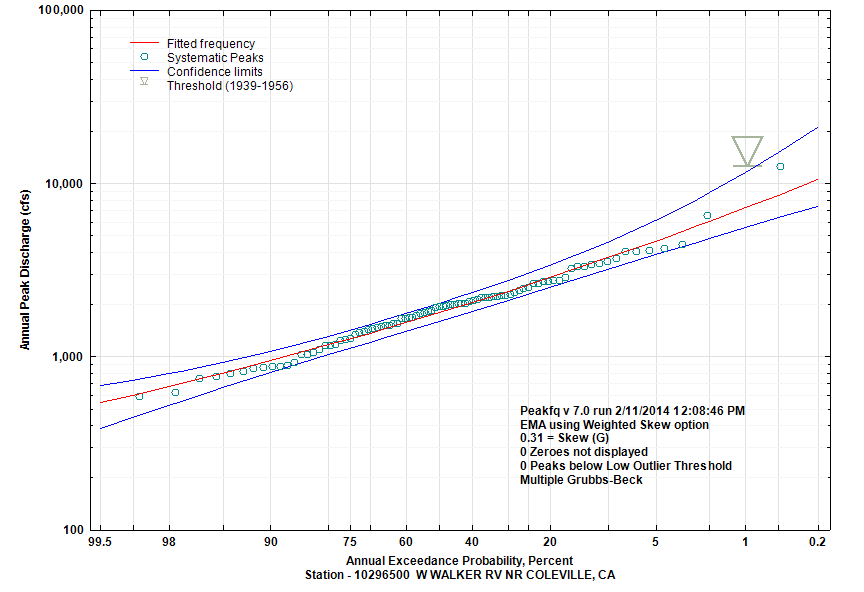
| Annual Exceedance Probablity (percent) | Annual Exceedance Flow (cfs) |
95% Confidence Interval (cfs) | |
|---|---|---|---|
| Lower |
Upper |
||
| 99.5 | 541 | 384.6 | 682.8 |
| 99 | 598.4 | 445.7 | 730.2 |
| 95 | 800.8 | 660.4 | 918.6 |
| 90 | 944.5 | 809.6 | 1069 |
| 80 | 1164 | 1025 | 1310 |
| 66.67 | 1429 | 1267 | 1608 |
| 50 | 1788 | 1585 | 2022 |
| 42.92 | 1968 | 1743 | 2234 |
| 20 | 2856 | 2499 | 3344 |
| 10 | 3706 | 3177 | 4555 |
| 4 | 4955 | 4090 | 6665 |
| 2 | 6019 | 4804 | 8787 |
| 1 | 7202 | 5542 | 11500 |
| 0.5 | 8522 | 6309 | 14970 |
| 0.2 | 10500 | 7372 | 21040 |
