Walker River Basin
#Recordset1.GageName#
Gaging Station #Recordset1.GageNumber#
Streamflow Data from NWISweb:
Real Time || Daily Streamflow Statistics || Peak Streamflow
Peak Flow Data:
| Flood Event | Discharge Date | Peak (cfs) |
Stage (feet) |
|---|---|---|---|
#Recordset3.Name# |
#LSDateFormat(Recordset3.DateDischarge,'M/DD/YYYY')# |
#LSNumberFormat(Recordset3.PeakDischarge,',99999999999999')##Recordset3.peak_CD# |
#Recordset3.Stage# |
- 2Discharge is an Estimate
- BMonth or Day of occurrence is unknown or not exact
- EOnly Annual Maximum Peak available for this year
Annual Peak Flows:
Flood Frequency:
Additional flood-frequency descriptions will be added as available.
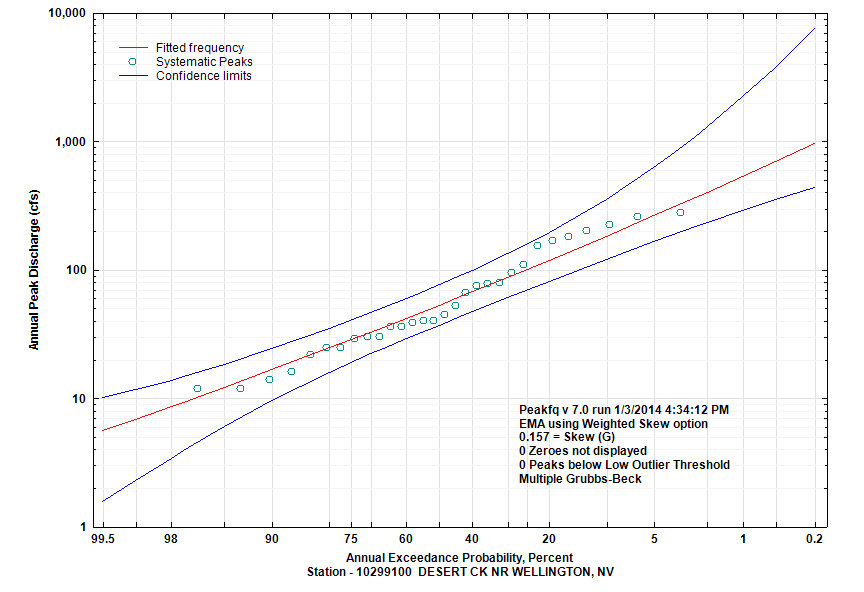
| Annual Exceedance Probablity (percent) | Annual Exceedance Flow (cfs) |
95% Confidence Interval (cfs) | |
|---|---|---|---|
| Lower |
Upper |
||
| 99.5 | 5.6 | 1.6 | 10.2 |
| 99 | 6.9 | 2.3 | 11.7 |
| 95 | 12.2 | 6 | 18.4 |
| 90 | 16.7 | 9.6 | 24.3 |
| 80 | 24.6 | 16 | 35.2 |
| 66.67 | 35.7 | 24.4 | 50.9 |
| 50 | 53.1 | 37.1 | 76.9 |
| 42.92 | 62.8 | 43.9 | 92.1 |
| 20 | 118.6 | 81.4 | 194.4 |
| 10 | 183.1 | 121.1 | 352.7 |
| 4 | 294 | 181.8 | 748 |
| 2 | 401.6 | 233.4 | 1299 |
| 1 | 533.9 | 289.6 | 2230 |
| 0.5 | 695 | 350.1 | 3789 |
| 0.2 | 960.8 | 436.5 | 7544 |
