Walker River Basin
#Recordset1.GageName#
Gaging Station #Recordset1.GageNumber#
Streamflow Data from NWISweb:
Real Time || Daily Streamflow Statistics || Peak Streamflow
Peak Flow Data:
| Flood Event | Discharge Date | Peak (cfs) |
Stage (feet) |
|---|---|---|---|
#Recordset3.Name# |
#LSDateFormat(Recordset3.DateDischarge,'M/DD/YYYY')# |
#LSNumberFormat(Recordset3.PeakDischarge,',99999999999999')##Recordset3.peak_CD# |
#Recordset3.Stage# |
- 2Discharge is an Estimate
- BMonth or day of occurrence is unknown or not exact
Annual Peak Flows:
Flood Frequency:
Additional flood-frequency descriptions will be added as available.
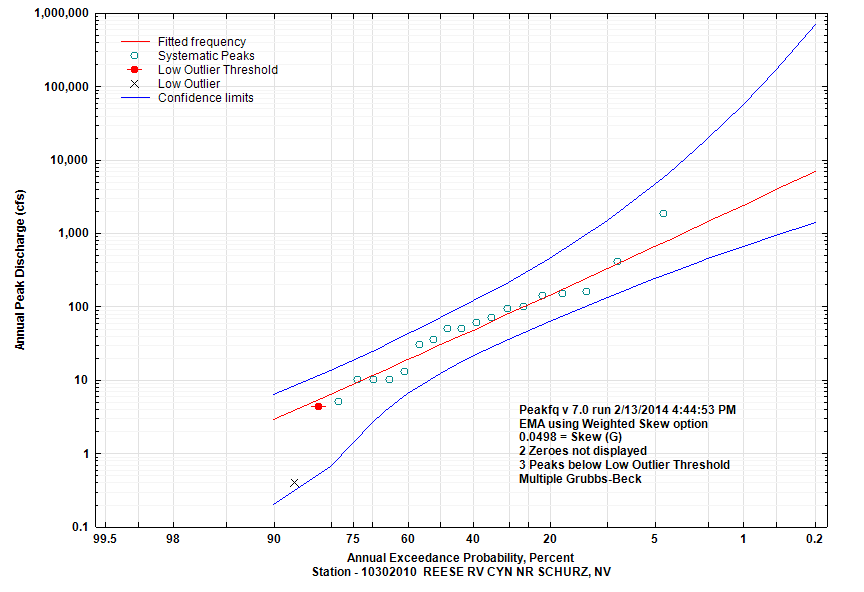
| Annual Exceedance Probablity (percent) | Annual Exceedance Flow (cfs) |
95% Confidence Interval (cfs) | |
|---|---|---|---|
| Lower |
Upper |
||
| 90 | 2.9 | 0.2 | 6.3 |
| 80 | 6.4 | 0.7 | 13.3 |
| 66.67 | 13.5 | 3.7 | 29.5 |
| 50 | 29.9 | 12.3 | 70.5 |
| 42.92 | 41.6 | 18.2 | 101.8 |
| 20 | 143.3 | 62.1 | 454.3 |
| 10 | 328.1 | 131.7 | 1477 |
| 4 | 799 | 281.5 | 6518 |
| 2 | 1425 | 447.1 | 19370 |
| 1 | 2404 | 662.9 | 56850 |
| 0.5 | 3887 | 932.5 | 166200 |
| 0.2 | 6978 | 1376 | 689100 |
